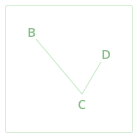
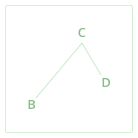
3 Point Retracement is a Fibonacci pattern. It is defined by three points B, C, and D, of which:
- For a bearish 3 Point Retracement, points B and D are tops of the price plot, and point C is a bottom between them.
- For a bullish 3 Point Retracement, points B and D are bottoms of the price plot, and point C is a top between them.

- The segment BC is a downtrend segment followed by a retracement to the top CD.
- The price difference between B and C is about 61.8% of the price difference between C and D.

- The segment BC is an uptrend segment followed by a retracement to the bottom CD.
- The price difference between B and C is about 61.8% of the price difference between C and D.
When the pattern is complete, it may suggest that the price is likely to find support or resistance at one of the Fibonacci levels calculated based on the price level of point D. Note that the Fibonacci levels are only displayed for the last Fibonacci pattern on the chart.
For educational purposes only. Not a recommendation of a specific security or investment strategy.
Technical analysis is not recommended as a sole means of investment research.
Past performance of a security or strategy does not guarantee future results or success.