Description
Gap Momentum is a technical indicator that evaluates price strength using opening gaps. The study accumulates gap values to calculate a ratio, which is then compared against a smoothed signal line.
The Gap Momentum ratio is calculated as the sum of positive gaps divided by the sum of negative gaps over the specified period. A gap is considered positive when the open price is higher than the previous close and negative otherwise.
The signal line is calculated as the average value of the Gap Momentum ratio over the defined signal length period. Crossings between the signal line and the Gap Momentum plot can indicate trend reversals.
Input Parameters
| Parameter | Description |
|---|---|
length
|
The length of the period used to accumulate gap prices. |
signal length
|
The length of the period used to calculate the signal line. |
full range
|
Defines whether the study is initialized using the first bar in the lookup period or the current bar. |
Plots
| Plot | Description |
|---|---|
GapMomentum
|
The Gap Momentum plot. |
Signal
|
The signal line. |
Further Reading
1. "Taking A Page From the On-Balance Volume – Gap Momentum" by Perry J. Kaufman. Technical Analysis of Stocks & Commodities, January 2024.
Example*
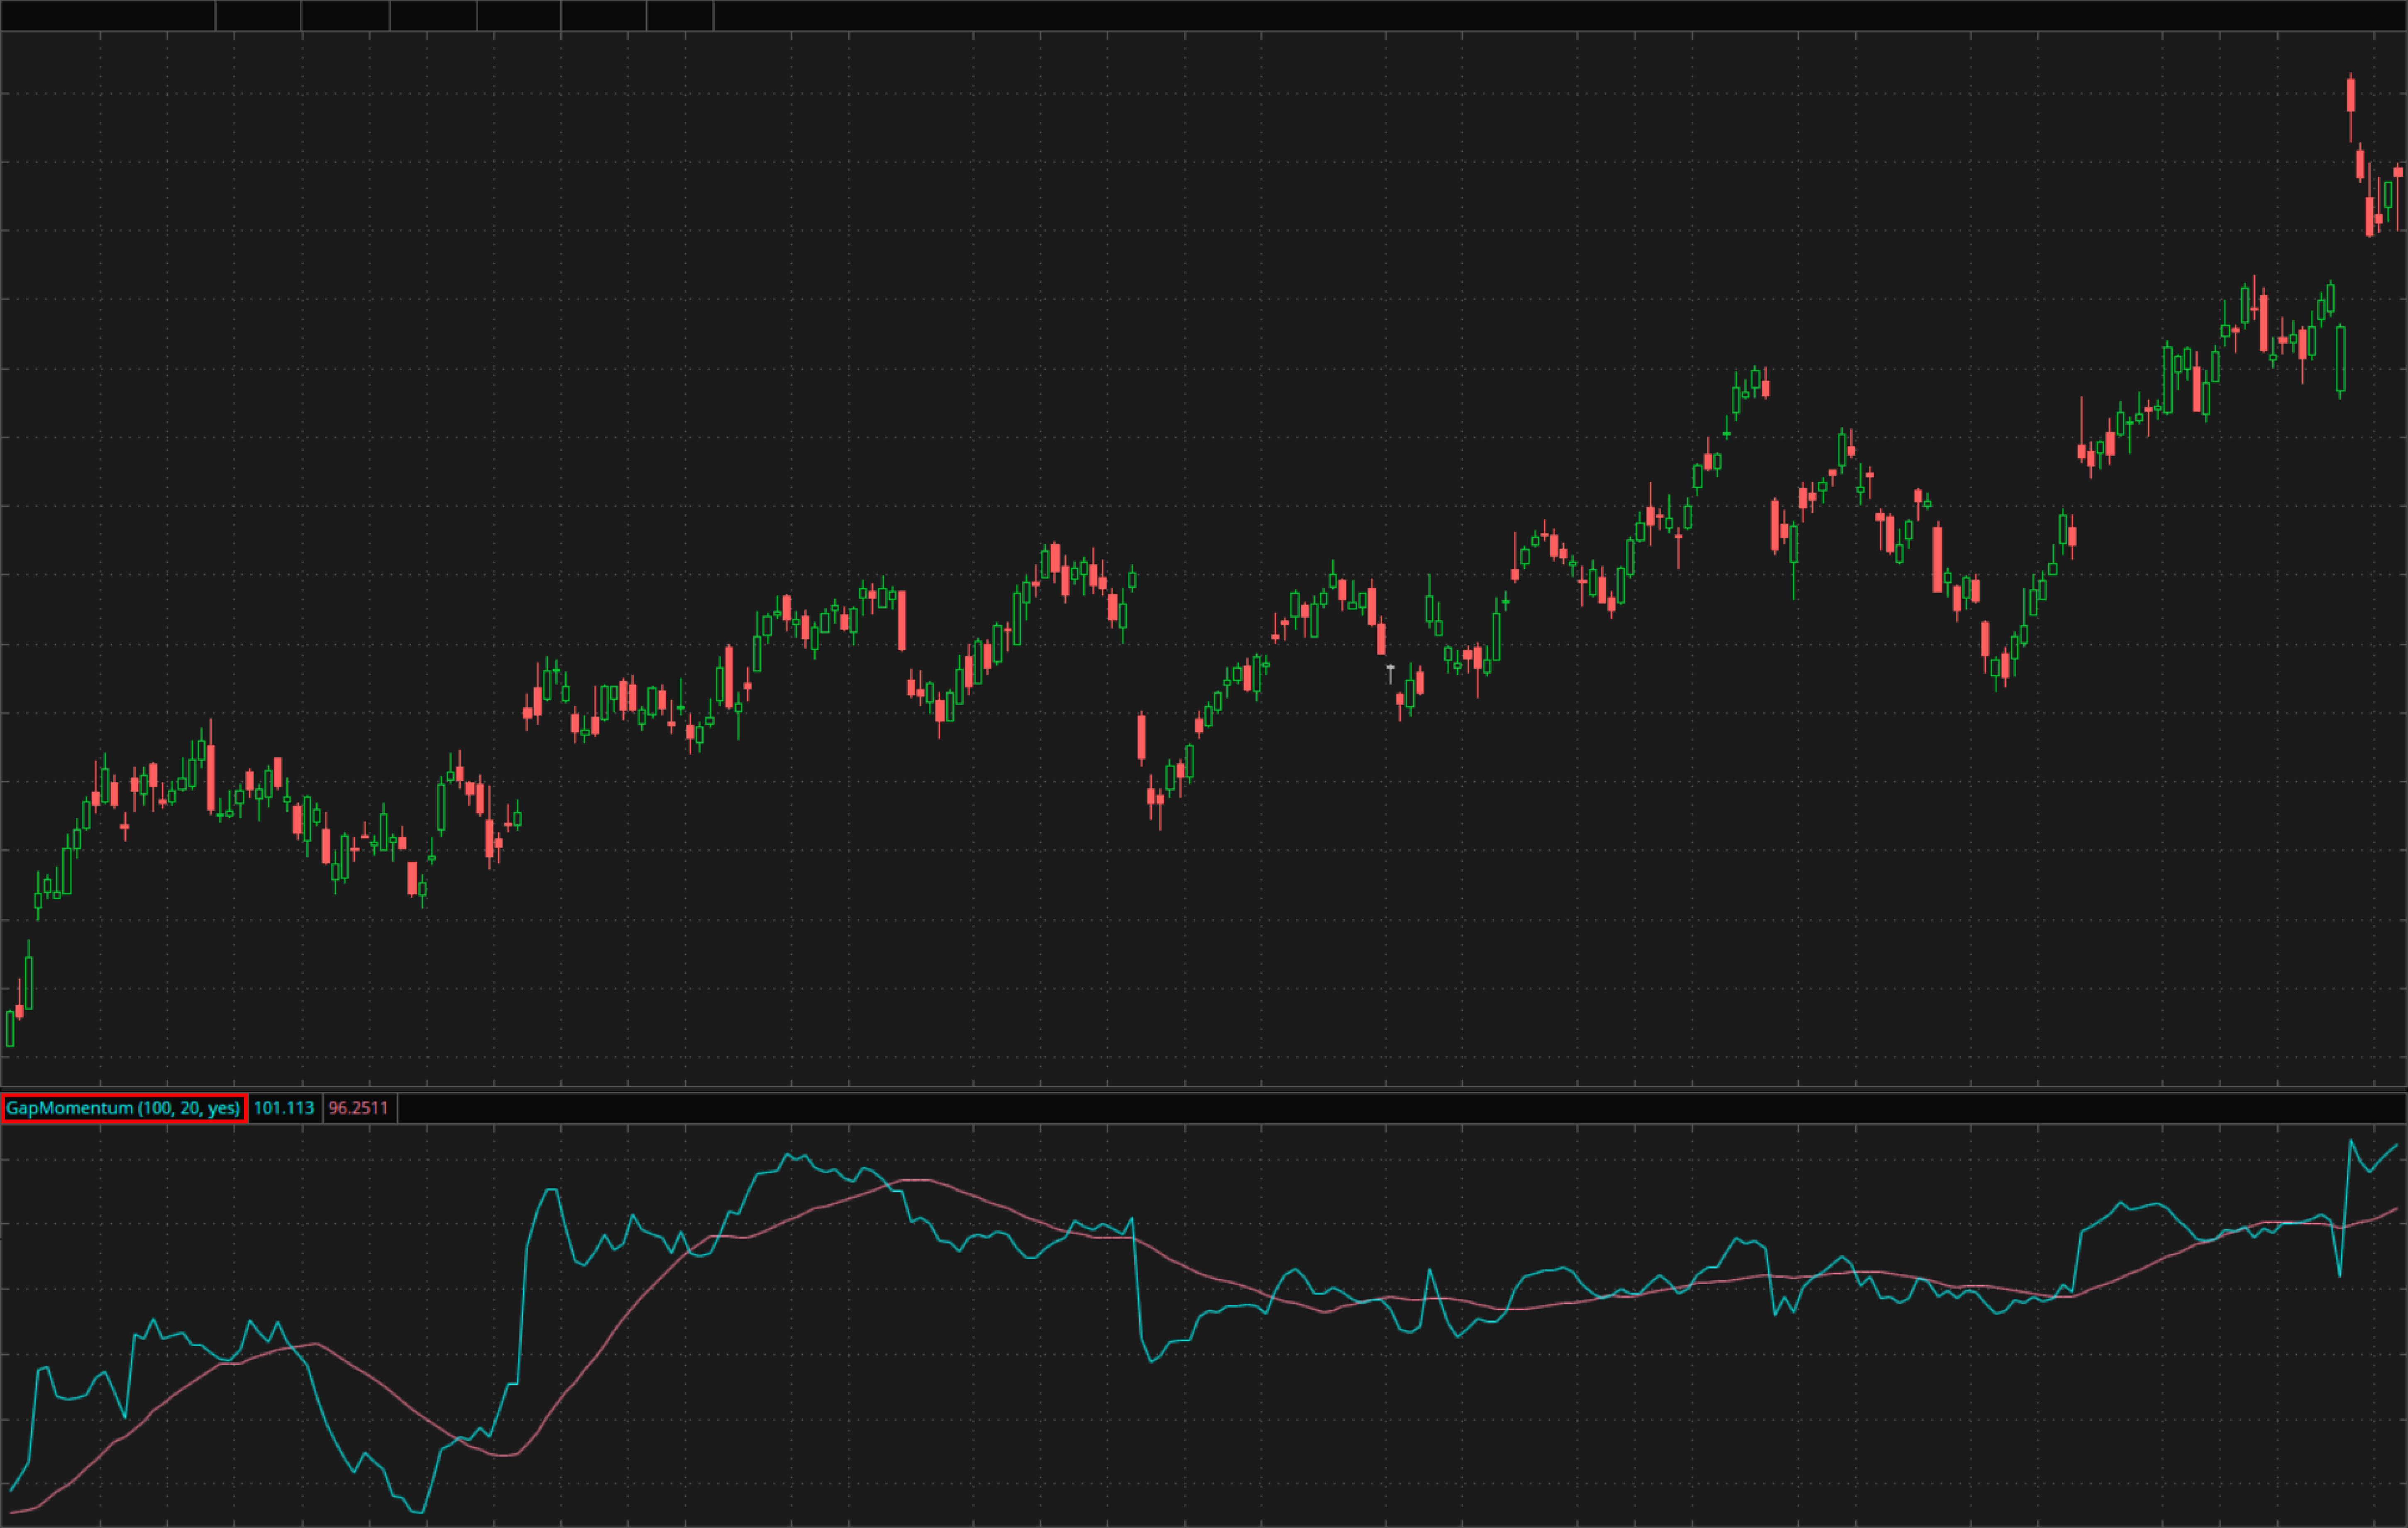
* For illustrative purposes only. Not a recommendation of a specific security or investment strategy.
Past performance is no guarantee of future performance.