Description
The Historical Volatility study calculates volatility which can be expressed by the following formula:
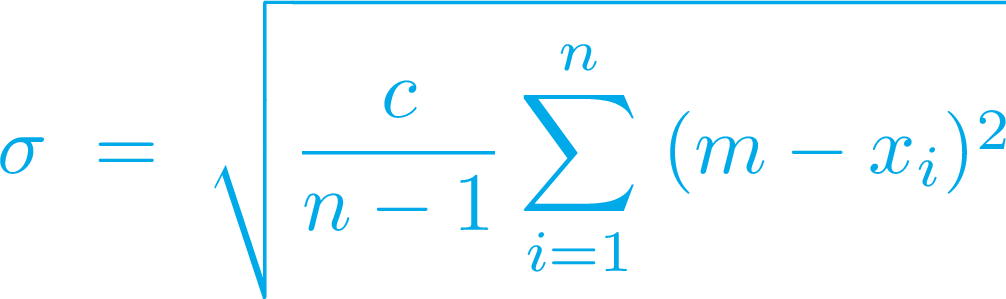
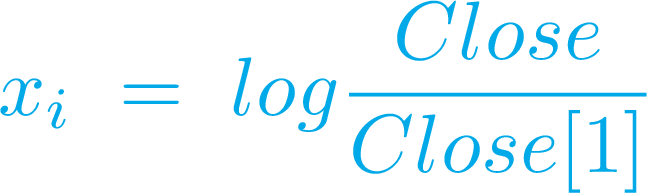
where c is a coefficient depending on the volatility basis and m is average of logarithmic return xi which, in turn, is calculated as follows:
Input Parameters
| Parameter | Description |
|---|---|
length
|
The number of bars used to calculate Historical Volatility. |
basis
|
The volatility basis. |
Plots
| Plot | Description |
|---|---|
HV
|
The Historical Volatility plot. |
Example*
*For illustrative purposes only. Not a recommendation of a specific security or investment strategy.