Description
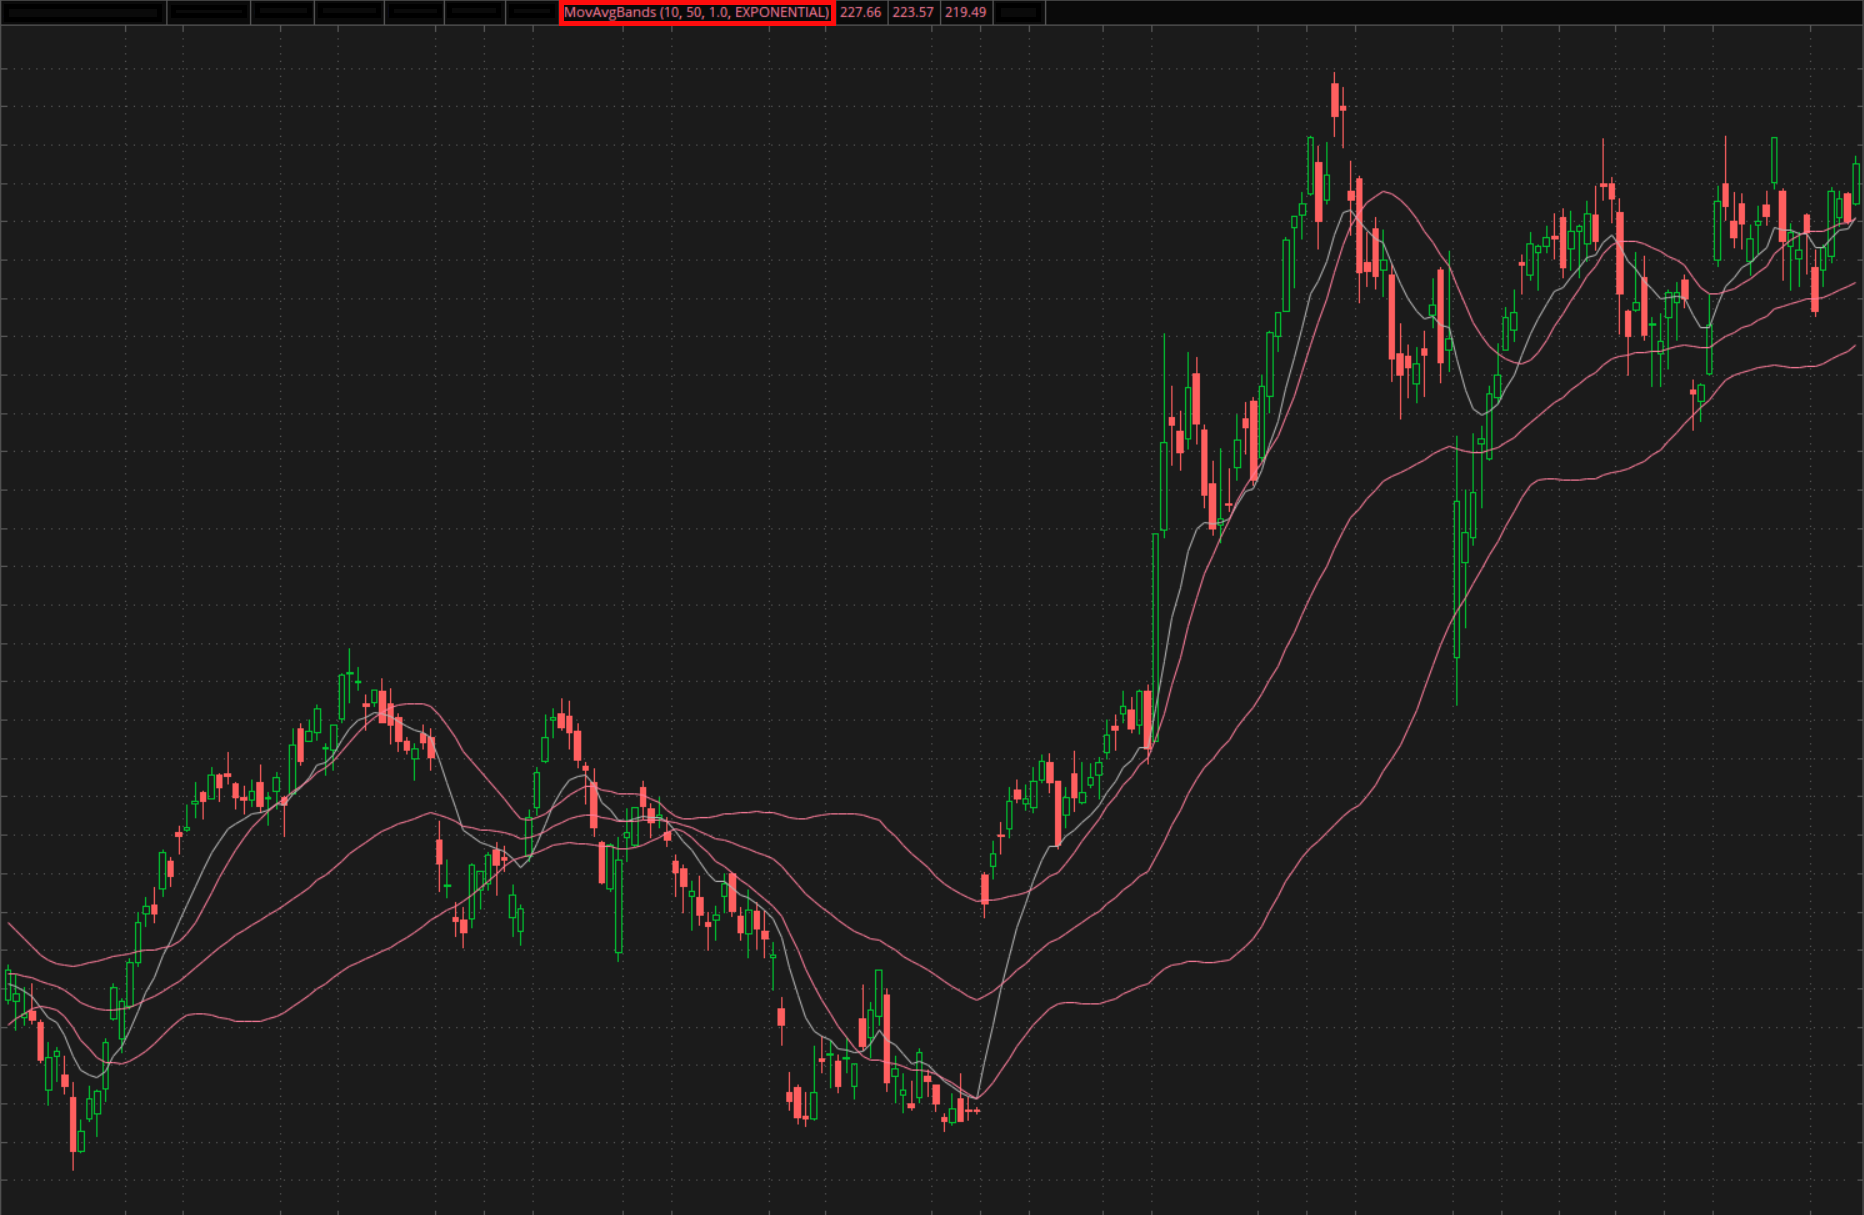
The Moving Average Bands study is a technical indicator developed by Vitali Apirine. It is calculated as follows:
- Two moving averages of the specified type are calculated. The slower moving average is used as a middle band.
- The root mean square of the difference of two moving averages is calculated. In the context of this indicator, it is considered the measure of volatility.
- By default, upper and lower bands are plotted one deviation above and below the middle band. The number of deviations can be edited in the input parameters.
Four lines are calculated: the upper band, the lower band, the middle band (same as the slower average), and the fast average. The general trend of the bands can be used for confirmation of the price trend. The upper and lower bands can be used as dynamic overbought and oversold levels. The faster moving average’s crossovers with the upper and lower bands can help identify entry and exit points.
Input Parameters
| Parameter | Description |
|---|---|
fast length
|
The length of the fast moving average. |
slow length
|
The length of the slow moving average. |
multiplier
|
The number of deviations defining the distance between the middle band and the upper and lower bands. |
average type
|
The type of moving average to be used in calculations: simple, exponential, weighted, Wilder's, or Hull. |
Plots
| Plot | Description |
|---|---|
UpperBand
|
The upper moving average band. |
SlowAverage
|
The slow average plot (middle band). |
LowerBand
|
The lower moving average band. |
FastAverage
|
The fast moving average plot. |
Further Reading
1. "Moving Average Bands Part 1" by Vitali Apirine. Technical Analysis of Stocks & Commodities, July 2021.
Past performance is no guarantee of future performance.
Example*
*For illustrative purposes only. Not a recommendation of a specific security or investment strategy.
Past performance is no guarantee of future performance.
