Description
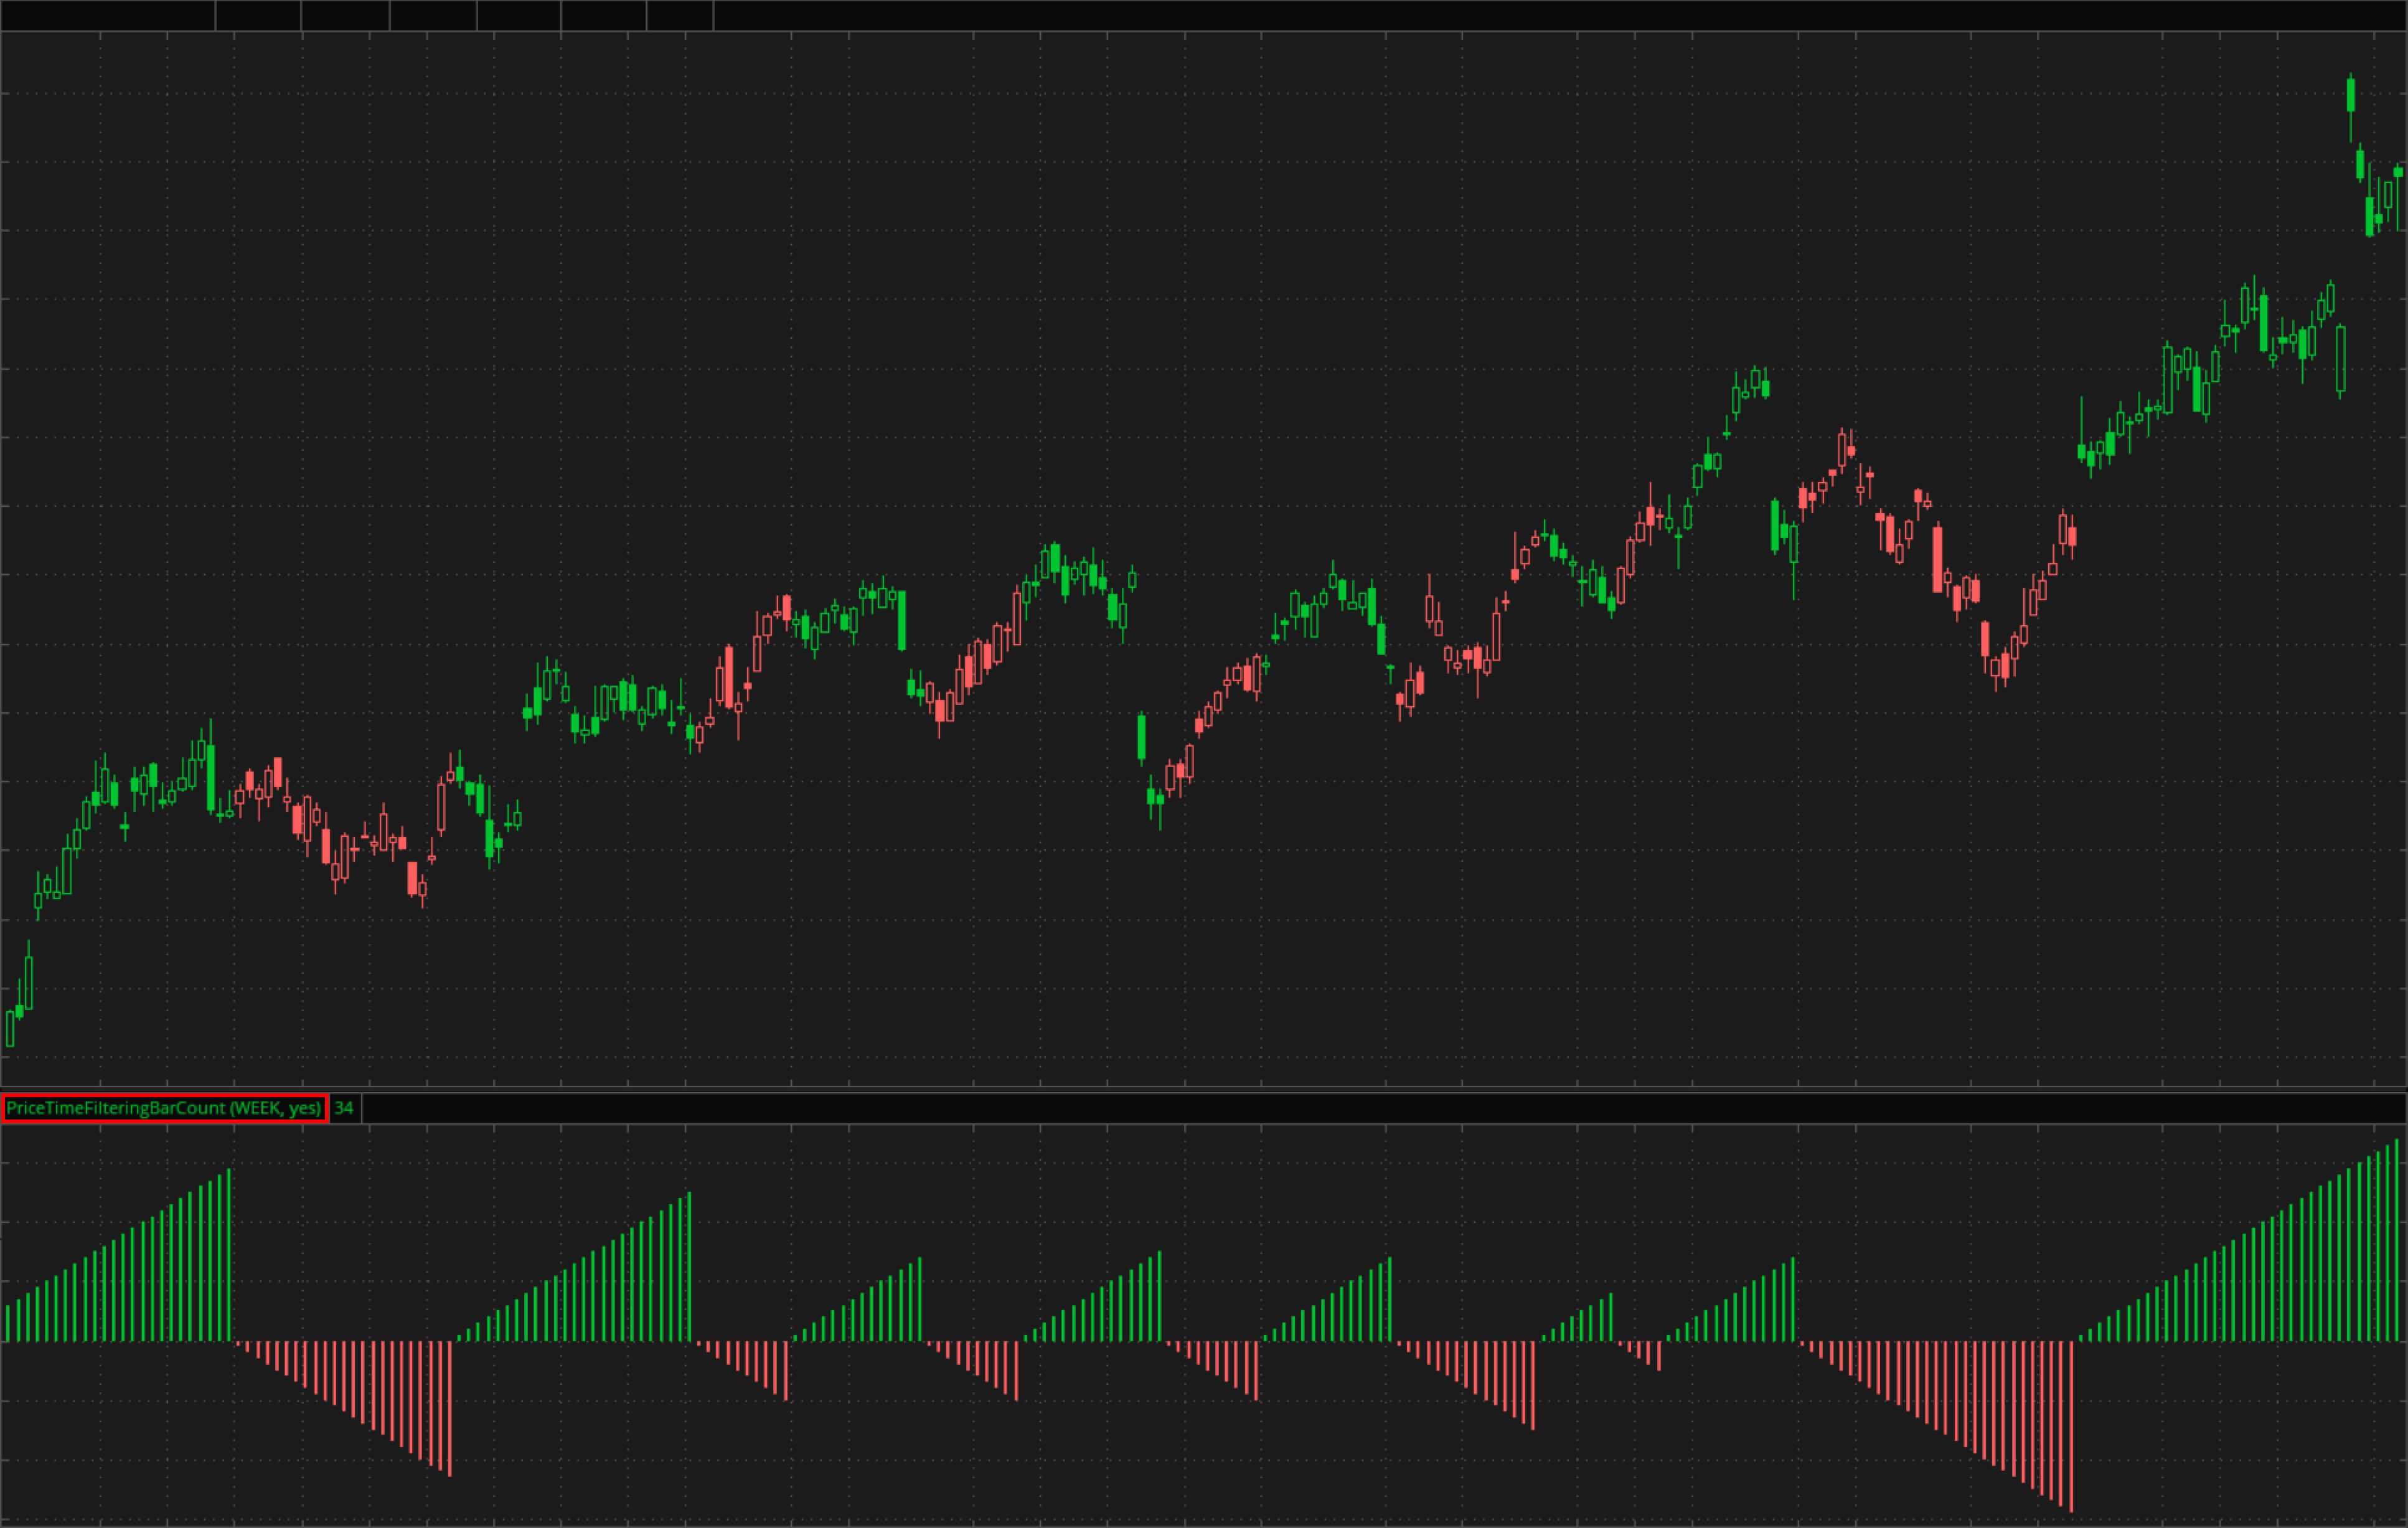
PriceTimeFilteringBarCount is a technical indicator designed to monitor trend growth. The study identifies trend direction and plots a histogram using the number of bars in a trend.
PriceTimeFilteringBarCount identifies trend direction using the following rules:
- Uptrend. If the close price of the most recent period is greater than the high price of the previous period.
- Downtrend. If the close price of the most recent period is less than the low price of the previous period.
- The trend maintains direction until changed by one of the above rules.
The histogram can be interpreted as follows:
- Positive histogram bars represent uptrends and negative bars represent downtrends.
- The size of each histogram bar increases sequentially as long as a trend persists.
Consider using this indicator with PriceTimeFilteringAccVolume, which analyzes cumulative volume for each trend period.
Input Parameters
| Parameter | Description |
|---|---|
aggregation period
|
The aggregation period used in the calculations. |
paint bars
|
Defines whether to apply the user-defined color scheme or the default trend color scheme (red for downtrend and green for uptrend) to the price plot. |
Plots
| Plot | Description |
|---|---|
BarCount
|
The Price Time Filtering Bar Count plot. |
Further Reading
1. "Riding Sustained Price Trends – Trend Identification By Price And Time Filtering" by Alfred François Tagher. Technical Analysis of Stocks & Commodities, February 2024.
Example*
*For illustrative purposes only. Not a recommendation of a specific security or investment strategy.
Past performance is no guarantee of future performance.