Description
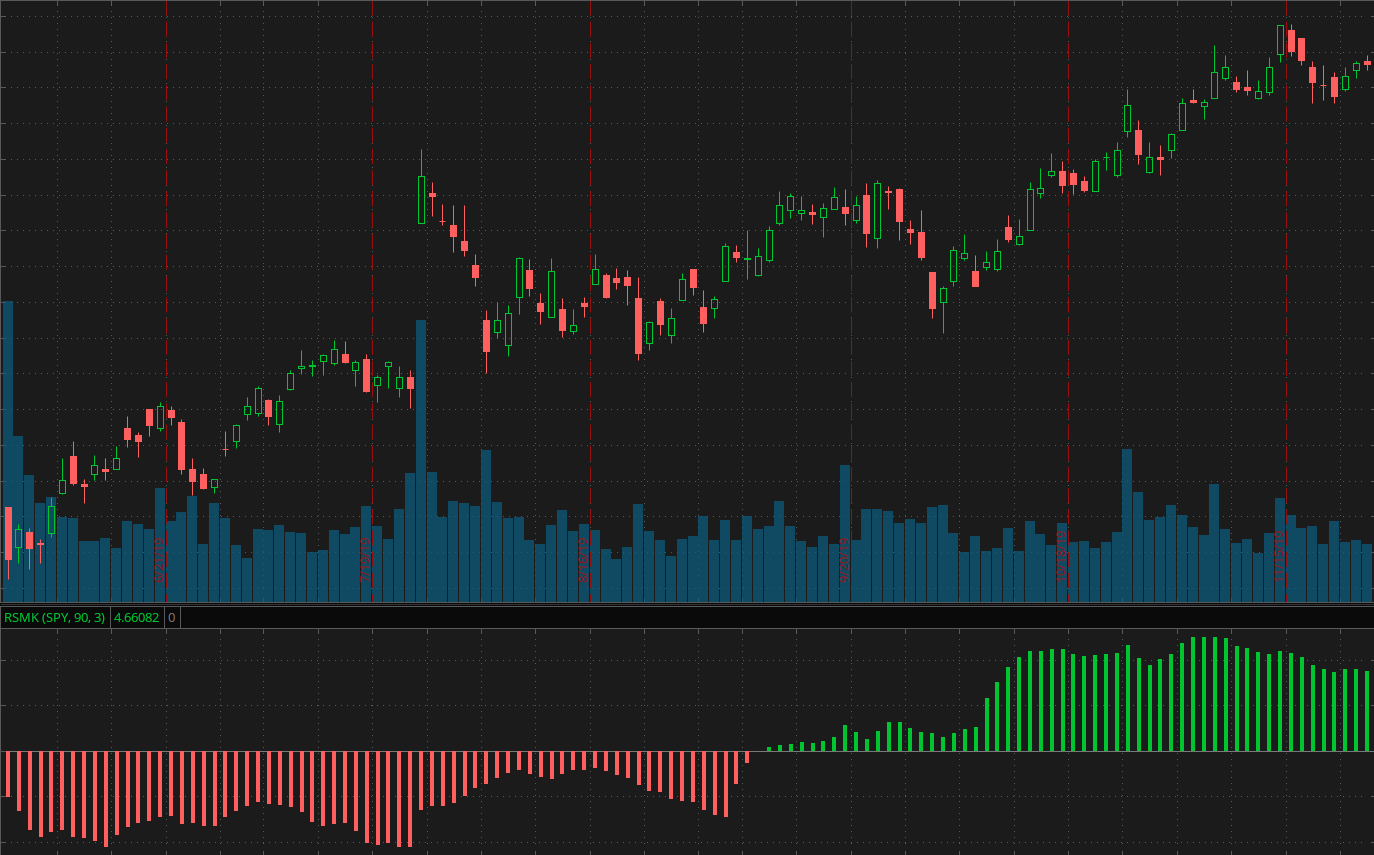
RSMK is a technical indicator introduced by Markos Katsanos in an attempt to improve existing relative strength-based indicators. RSMK calculates the strength of a security relative to another security or index. It can be used to analyze intermarket relationships.
RSMK is calculated using the following algorithm:
- The system calculates the natural logarithm of the ratio of the primary security's close to that of the secondary symbol.
- The same value is calculated for a past bar (by default, 90 bars back).
- The difference between the two logarithms is smoothed by an exponential moving average.
Positive values of RSMK signify that the primary symbol outperforms the secondary one. Conversely, negative RSMK values signify that the secondary symbol outperforms the primary one.
Input Parameters
| Parameter | Description |
|---|---|
correlation with security
|
The security or index to compare the primary symbol with. |
rs length
|
The period to calculate the relative strength for. |
average length
|
The length of the exponential moving average. |
Plots
| Plot | Description |
|---|---|
RelativeStrength
|
The RSMK histogram. |
ZeroLine
|
The zero level. |
Further Reading
1. "Using Relative Strength To Outperform The Market" by Markos Katsanos. Technical Analysis of Stocks & Commodities, March 2020.
Example*
 *For illustrative purposes only. Not a recommendation of a specific security or investment strategy.
Past performance is no guarantee of future performance.