Description
Copy link to the section
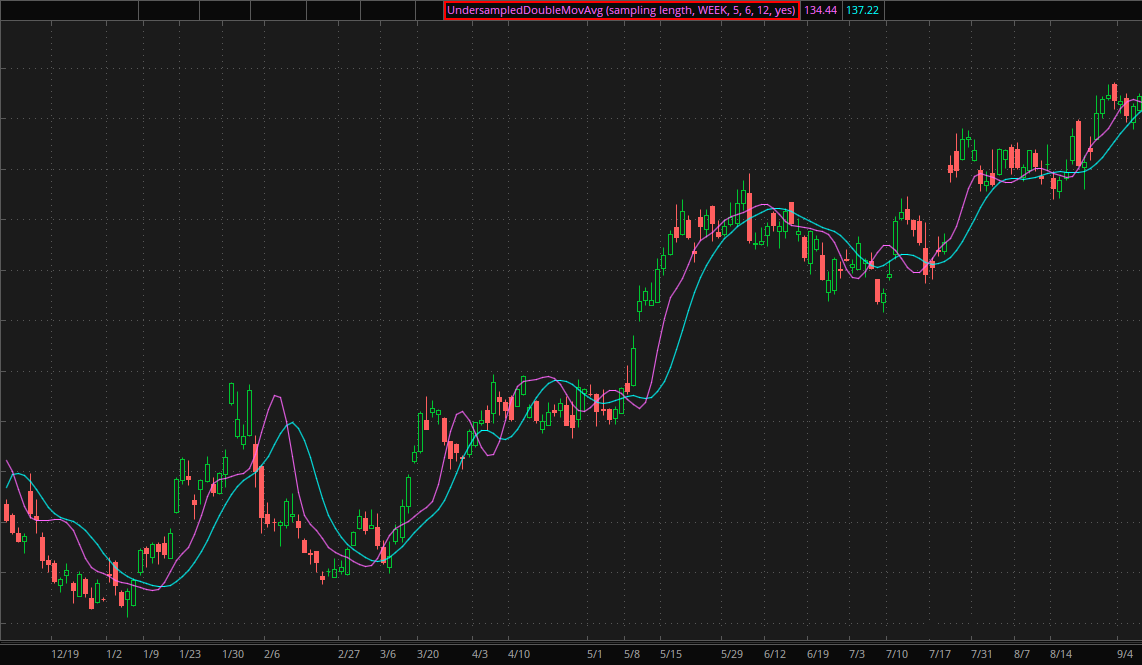
The Undersampled Double Moving Average is a technical indicator that uses signal processing techniques to find long-term trading patterns. The study undersamples data and smooths high frequency components. Since it considers market data to be discrete, values are returned based on a specified frequency (sample). The study suggests that lower frequencies (undersampling) reduce lag and contribute to a more accurate trend identification.
This frequency is calculated as the remainder of the current bar’s number divided by the defined time frame. If the result is 1, the close price of the corresponding bar is assigned to the sample. In practice, the closing price is periodically retrieved (e.g., every 5 days, every 15 minutes, etc.). On intraday charts, opening gap values can be removed to adjust for volatility.
The study filters the sampled data using FIR_Hann with two different lengths. This allows analyzing the data on two time frames with reduced noise and lag.
Input Parameters
| Parameter | Description |
|---|---|
sampling
|
Defines which length to use in the sampling: user-defined or secondary aggregation. |
aggregation period
|
The aggregation period used in the calculation. |
sampling length
|
The frequency of undersampled bars. |
fast length
|
The fast length of the Hann window. |
slow length
|
The slow length of the Hann window. |
adjust for gaps
|
Defines if opening gap values are removed on intraday charts. |
Plots
| Plot | Description |
|---|---|
FastAverage
|
The undersampled fast moving FIR_Hann plot. |
SlowAverage
|
The undersampled slow moving FIR_Hann plot. |
Example*
*For illustrative purposes only. Not a recommendation of a specific security or investment strategy.
Past performance is no guarantee of future performance.
