The Active Trader Ladder is a real-time data table that displays bid, ask, and volume data for the current symbol based on a price breakdown. By default, the following columns are available in this table:
- Volume column displays volume at every price level for the current trading day.
- Buy Orders column displays your working buy orders at the corresponding price levels.
- Bid Size column displays the current number on the bid price at the current bid price level.
- Price displays the price breakdown; prices in this column are sorted in descending order and have the same increment equal, by default, to the tick size. You can change this increment by clicking i/j (Zoom In/ Zoom Out) buttons in the control bar to the right of the table. Current market price is highlighted in gray. To center the Active Trader Ladder so the market price is exactly in the middle, click k (Center View) in the control bar to the right.
- Ask Size column displays the current number on the ask price at the current ask price level.
- Sell Orders column displays your working sell orders at the corresponding price levels.
Customizing Active Trader Ladder
Copy link to the section
Columns in the Active Trader Ladder are customizable: click on the (small gear) button in the top right corner of the table and choose Customize; the Customize Active Trader dialog will appear. Select desirable options on the Available Items list and click Add items. Additional items, which may be added, include:
- Fills will display the number of orders that have filled during the day, at their corresponding price levels. Clicking on a cell in this column will display a pop-up window with filled trades at the corresponding price.
- Orders will display pills of working buy and sell orders in a single column at their corresponding price levels.
- P/L Open will display profit/loss values since the position was opened, calculated at every price level.
- Trade Cnt will display the number of trades at every price level for the current trading day. Clicking on a cell in this column will bring up a pop-up window displaying the details of your trades made on the symbol. Switch to the Lot Detail tab of the same window to view the tax lot information pertaining to that position.
You can also remove unnecessary columns by selecting them on the Current Set list and then clicking Remove Items. Click OK to update the Active Trader Ladder columns.
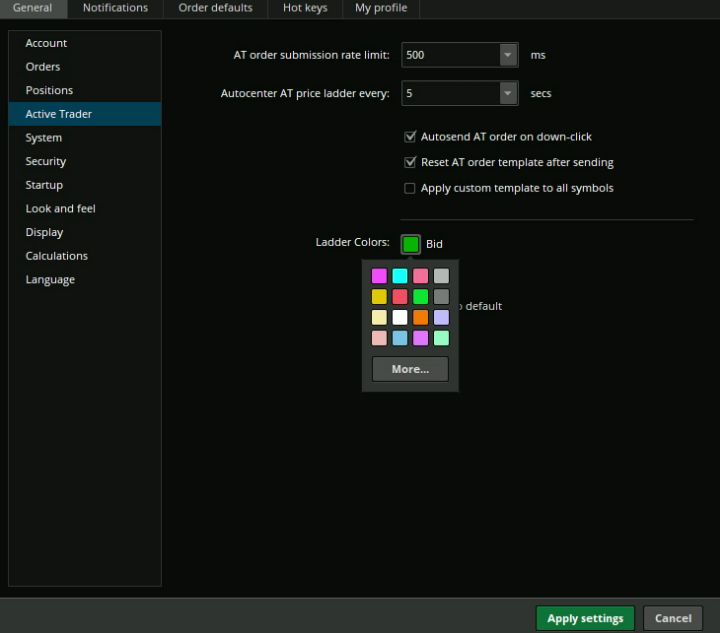
In addition to customizing columns, you can change the Bid and Ask colors for the ladder. Navigate to Setup > Application Settings > Active Trader > Ladder Colors to select your colors or reset them to default if needed.
Viewing study values in the Active Trader Ladder
Copy link to the section
You can include values of technical indicators to the Active Trader ladder view:
- Add some studies to the Active Trader Chart.
- Click the small gear button in the top right corner of the Active Trader Ladder.
- Select Show Chart Studies.
- Look for your study values in the Price column: those will be marked by circles, triangles, squares, or diamonds at corresponding price values. Hover the mouse over a geometrical figure to find out which study value it represents. If some study value does not fit into your current view (i.e., it is too high or too low), you will see an arrow pointing in the direction to scroll the ladder to find this value.
- You can add orders based on study values, too. Right-click on the geometrical figure of the desirable study value and choose Buy or Sell. Proceed with the order confirmation.
Position Summary
Copy link to the section
Above the table, you can see the Position Summary, a customizable panel that displays important details of your current position. By default, the following metrics are displayed: buys and sells you’ve had during the trading day, total current position in the account, average price of the position currently in the account, the profit/loss value since the position was opened, and current day’s profit/loss.
- To customize the Position Summary, click Show actions menu and choose Customize... The Customize position summary panel dialog will appear. Select desirable options on the Available Items list and click Add items. The only additional item that is not displayed by default is Day only position, which will display today’s total position.
- You can also remove unnecessary metrics by selecting them on the Current Set list and then clicking Remove Items. Click OK to update the Active Trader Ladder columns.
Crosshairs synchronization
Copy link to the section
You can synchronize your charts crosshairs with the Active Trader Ladder in the menu accessible from the small gear icon. When synchronized, moving your mouse across the ladder will automatically move the chart crosshairs across the corresponding price levels if they are contained in the current price range. Similarly, moving your mouse across the chart will automatically highlight the corresponding price on the ladder if this price is contained within the current ladder view.
