For illustrative purposes only, not a recommendation.
Description
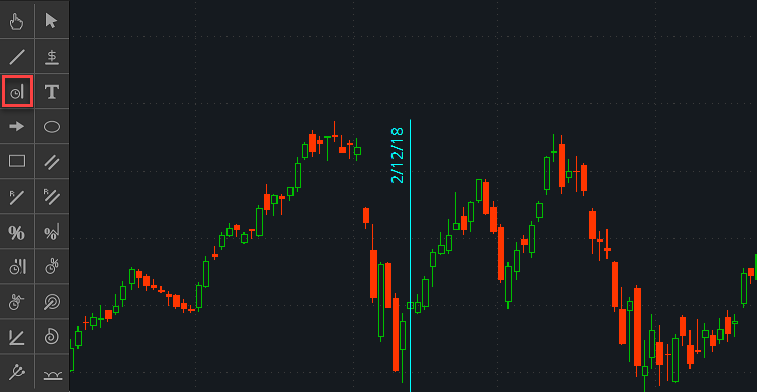
Time level is a simple vertical line marking a certain time point.
In order to add the time level to chart, choose it from the Active Tool menu. Specify two points belonging to it and the price level will appear on chart.
Properties
Appearance:
-
Visible. Set this property to "Yes" in order to hide the time level.
-
Upward extension. Set this property to "On" to extend the time level all the way up. This option is also available from the right-click context menu.
-
Downward extension. Set this property to "On" to extend the price level all the way down. This option is also available from the right-click context menu.
-
Show name. Edit this property to display the time level name at the lower or the upper edge or not to show it at all.
-
Date. Edit this property to display the date/time value at the lower or the upper edge or not to show it at all.
Begin point:
-
Value. Defines the price value corresponding to the begin point of the time level.
-
Date/Time. Defines the time scale value corresponding to the begin point.
End point:
-
Value. Defines the price scale value corresponding to the end point.