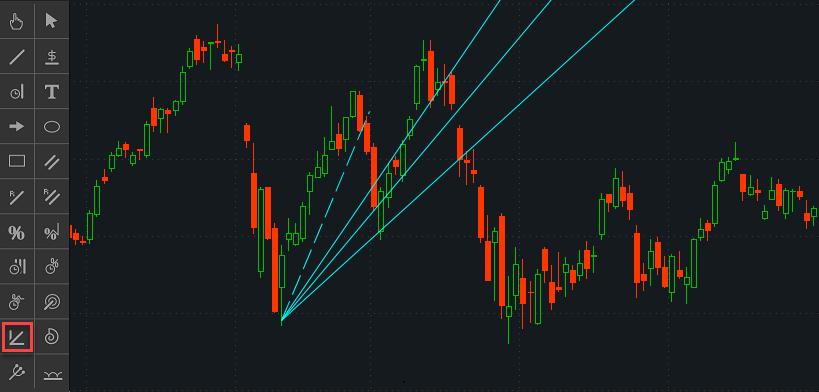
For illustrative purposes only, not a recommendation.
Description
Fibonacci fans are a combination of trendlines plotted from a single point and distant from each other based on Fibonacci ratios. Fibonacci fans share the main idea with Fibonacci retracements: using Fibonacci ratios in order to predict future support/resistance levels. On an uptrend period, it is suggested that the main trendline be plotted from the bottom to top so that retracement lines are placed below it; these lines might predict potential support levels. Conversely, on a downtrend section, the fan is plotted from the top to bottom, the retracement lines appear above the main trendline, serving as potential resistance levels.
In order to add the Fibonacci fans drawing to chart, choose it from the Active Tool menu. Specify begin and end points of the trendline (consider using peaks and troughs for these purpose); the retracement lines will be added automatically.
Properties
Appearance:
-
Visible. Set this property to "No" in order to hide the Fibonacci fans.
Begin point:
-
Value. Defines the price value corresponding to the begin point of the trendline.
-
Date/Time. Defines the time scale value corresponding to the begin point of the trendline.
End point:
-
Value. Defines the price value corresponding to the end point of the trendline.
-
Date/Time. Defines the time scale value corresponding to the end point of the trendline.
Fibonacci curve properties:
This section allows you to add extra retracement lines to the Fibonacci fans.
-
Visible. Defines which of the extra lines should be visible.
-
Coefficient. Defines the retracement percentage as a decimal.
-
Color. Defines the color of the line.
-
Style. Defines whether the line should be plotted as solid, long-dashed, or short-dashed.
-
Width. Defines the line width in pixels.
