For illustrative purposes only, not a recommendation.
Description
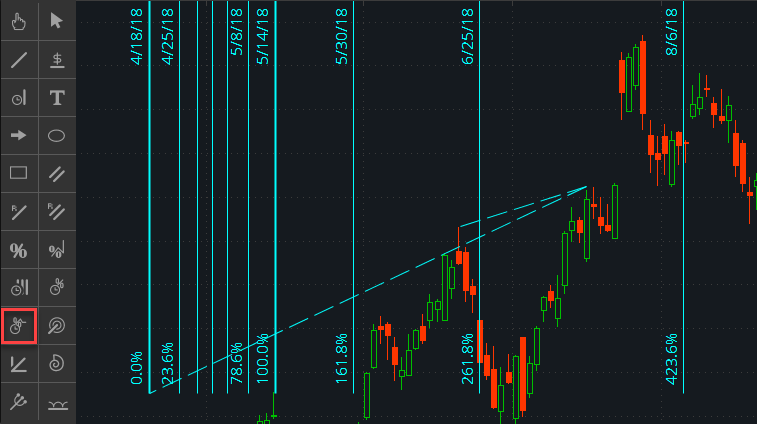
Fibonacci time extensions are a combination of Fibonacci extensions and Fibonacci time ratios. While being plotted much like the Fibonacci extensions, they feature vertical lines like Fibonacci time ratios do.
In order to add the Fibonacci time extensions drawing to chart, choose it from the Active Tool menu. Specify begin and end points of the trendline and extension line; the retracement levels will be calculated automatically.
Properties
Appearance:
-
Visible. Set this property to "No" in order to hide the Fibonacci time extensions.
-
Upward extension. Set this property to "On" to extend the lines all the way up.
-
Downward extension. Set this property to "On" to extend the lines all the way down.
-
Show coefficients. Defines where to display percentages corresponding to lines.
-
Show date. Defines where to display dates corresponding to lines.
-
Calculate ratios by. Set this property to "Time" so that the lines will be distanced based on time span between the first and the last one; otherwise the distances will be calculated based on the number of bars in the time span.
Begin point:
-
Value. Defines the price value corresponding to the begin point of the trendline.
-
Date/Time. Defines the time scale value corresponding to the begin point of the trendline.
Middle point:
-
Value. Defines the price value corresponding to the end point of the trendline.
-
Date/Time. Defines the time scale value corresponding to the end point of the trendline.
End point:
-
Value. Defines the price value corresponding to the end point of the extension line.
-
Date/Time. Defines the time scale value corresponding to the end point of the extension line.
Fibonacci curve properties:
This section allows you to add extra parallel lines to the Fibonacci extensions.
-
Visible. Defines which of the extra lines should be visible.
-
Coefficient. Defines the retracement percentage as a decimal.
-
Color. Defines the color of the line.
-
Style. Defines whether the line sjould be plotted as solid, long-dashed, or short-dashed.
-
Width. Defines the line width in pixels.
