The tools on the Analyze tabs allow you to create and manipulate simulated trades, examine risk profiles, and explore probabilities. The Analyze tab has the following subtabs: Add Simulated Trades, Risk Profile, Probability Analysis, Economic Data, thinkBack, Fundamentals, and Earnings.
Add Simulated Trades
The layout of Add Simulated Trades is similar to the interface of the Trade/All products subtab, however, the data on it is simulated. The Add Simulated Trades subtab allows you to enter a simulated trade and then analyze it including using other subtabs under Analyze.
To enter a simulated trade:
- Specify the symbol you would like to simulate a trade for.
- In the Option Chain pane, select an option or options you would like to simulate the trade for. To do so, click in the Ask X column to simulate buying or in the Bid X column to simulate selling. This will add the corresponding option to the Positions and Simulated Trades and Price Slices panes.
- In the Positions and Simulated trades pane, you can view calculated option metrics including historical and projected (volatility based). To view the metrics for a certain date, use the date picker on top of the pane.
- In the Prices Slices pane, you can view the projected Profit/Loss values for the trade you simulate based on the volatility and hypothetical price change. You can set different stock price targets (called price slices) as offsets from the current Mark Price or a Theo Price by clicking Option P/L Calculation. Price Slices can be set with percent, dollars, sigma, or estimated price range. Note that values are calculated for the date set in Positions and Simulated Trades.
- Switch to the Risk Profile subtab to calculate the probability of profit on this simulated trade.
- Switch to the Probability Analysis subtab to calculate the projected price range for the underlying.
Risk Profile
The Risk Profile functionality can help you calculate the theoretical probability of profit on the trade you’re simulating.
The Risk Profile graph has two axes: on the X-axis, you can see the potential stock price of the simulated trade’s underlying, and on the Y-axis, the potential profits and losses on the simulated trade. By default (dark color scheme), there are two curves shown on the graph: a blue curve that reflects the potential profit/loss value on the expiration date and a purple curve that reflects the same value for today (bade on the implied volatility). Note that on the light and SSE color schemes, the blue curve is shown in green.
The price slices you’ve set on the Add Simulated Trades subtab are also shown on the graph along with their respective calculated probability on the expiration date.
To simulate how time impacts the profit and loss on the trade (purple line), change the date in the Positions and Simulated Trades pane.
Probability Analysis
The Probability Analysis subtab visualizes the projected price range for the underlying in your simulated trade based on probability.
The Probability Analysis graph has two axes: the Y-axis represents the price of the underlying, and X-axis, days from the current date. By default, the price parabola that is shown on the graph represents the price range the underlying is projected to reach on a future date with a 68.27% probability (one standard deviation). Note that you can set your own probability value using the Probability range box on top of the graph.
thinkBack
The thinkBack tool is a thinkorswim feature designed for option back-testing. It stores nearly a decade of historical option trade data and allows you to back test strategies by entering hypothetical trades in this virtual trading environment.
To analyze a hypothetical past trade:
- Select the desired underlying in the symbol selector.
- In the date picker, select the desired past date. This will open the option chain constructed for that past date.
- Select an option that was available on that date and enter a hypothetical trade by clicking in the Ask or Bid column. This will activate Backtrades.
- In Backtrades, you can analyze metrics for your hypothetical position including the profit/loss value for the specified date. Selecting a different date will update the metric values accordingly.
Backtesting is the evaluation of a particular trading strategy using historical data. Results presented are hypothetical, they did not actually occur and there is no guarantee that the same strategy implemented today would produce similar results.
Earnings
The Earnings tab helps you research the effects of earnings announcements on the pricing of securities and derivatives.
When you select a symbol on the Earnings tab, it shows you the earnings events for each of the last eight quarters side-by-side. These are shown as miniature candle charts in the top row which represent the price action five days before and five days after the event.
Below the price charts, the Earnings functionality shows implied and historical volatility for the same dates around the corresponding events, the ATM Straddle pricing, and earnings per share (EPS).
Portfolio, Uniform Stress Test
The Portfolio, Uniform Stress Test mode lets you stress test positions at specific Price Slices (price targets offset from the current price) in the Positions and Simulated Trades section. This functionality is not available by default. For more information about enabling Portfolio Uniform, Stress Test, please contact chat support.
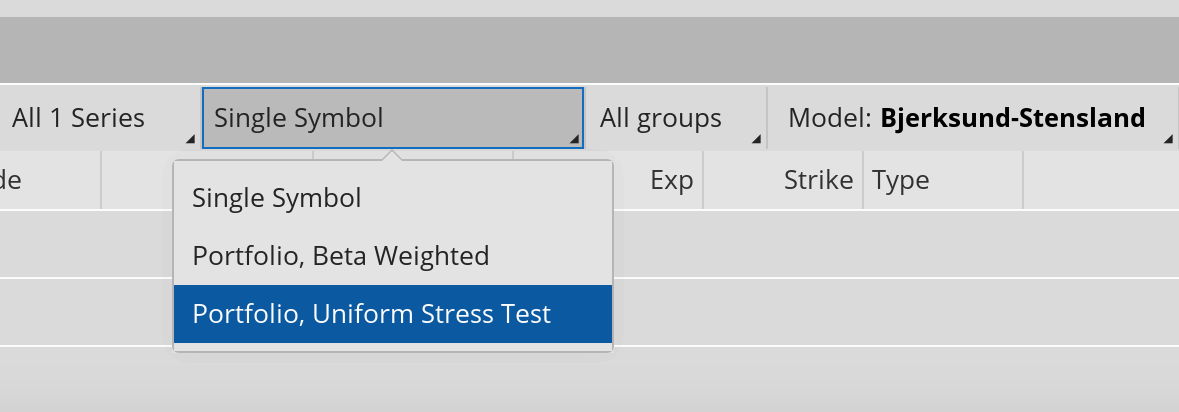
If enabled, click on the Single Symbol dropdown and select Portfolio, Uniform Stress Test to switch modes. From here you can add simulated trades, and the simulated trade price and P/L values will be calculated using the new model.
The Portfolio, Uniform Stress Test functionality can help you stress test positions in a symbol for enabled Price Slices by:
- Using Sticky Ratio volatility calculations to set the resulting Vol
- Testing all underlying positions using the selected Price Slice to get resulting P/L values: Day, Open, or Percent
- Calculating resulting P/L offset of each underlying group for the Price Slice
- Calculating resulting P/L values for each Price Slice
- Modifying the offset type will reset the value to zero rather than recalculating the corresponding offset.
With Portfolio, Uniform Stress Test you can also apply a volatility adjustment. The resulting volatility will be displayed in the Vol column of Positions and Simulated Trades.
Clicking View Trades will let you see the P/L Open values for each position in the calculations.
Note: Results may vary with each use and over time.