Welcome to thinkorswim®, a Charles Schwab platform for traders who want advanced tools for analyzing markets and placing trades across stocks, options, futures, and forex. It’s available as a desktop application, a web platform, and a mobile app. All versions include paperMoney®, a simulated trading environment where you can practice strategies without putting real money on the line.
|
Desktop App |
Web Version |
Mobile App |
|
|---|---|---|---|
|
Best for |
Full-featured trading and analysis |
Quick trades and monitoring from a browser |
Trading and monitoring on the go |
|
Installation |
Download required |
No download required |
App download required |
|
Charting |
Full |
Full |
Simplified |
|
thinkScript® |
Yes |
No |
No |
|
Cross-Platform Sync |
Yes |
Yes |
Yes |
This article gives you an overview of how the platform is organized and what you’ll find in each section. From here, you can follow the links to the dedicated articles for a deeper look into any feature.
How to create and fund an account on thinkorswim®
To get started with thinkorswim, you’ll need a Schwab brokerage account. You can open one here. For account setup guidance, see the Account Features article.
To fund your Schwab account, log in to schwab.com and navigate to your account settings.
If this is your first time trading, paperMoney® can be a good place to start. It’s a simulated trading environment that mirrors the live platform. You can find instructions for setting up paperMoney here.
thinkorswim® Workspace
The thinkorswim workspace is divided into two main areas: the left sidebar and the main window.
- The left sidebar is your at-a-glance command center. It displays your account balances and buying power in real time, and it’s where you can add gadgets that keep useful information visible while you work. These include things like a live news feed, watchlists, and quick charts, etc. To add a gadget, click the × symbol at the bottom of the sidebar and choose from the menu. For more, see the Left Sidebar article.
- The main window is where trading and analysis happens. It’s organized into eight tabs, each dedicated to a specific area of the platform. All tabs have subtabs that break functionality down further. In the thinkManual, you can find articles covering each one in detail.
You can adjust the look and feel of the platform at any time through the Setup menu in the upper right corner. From there, you can configure notifications, order defaults, display preferences, and language.
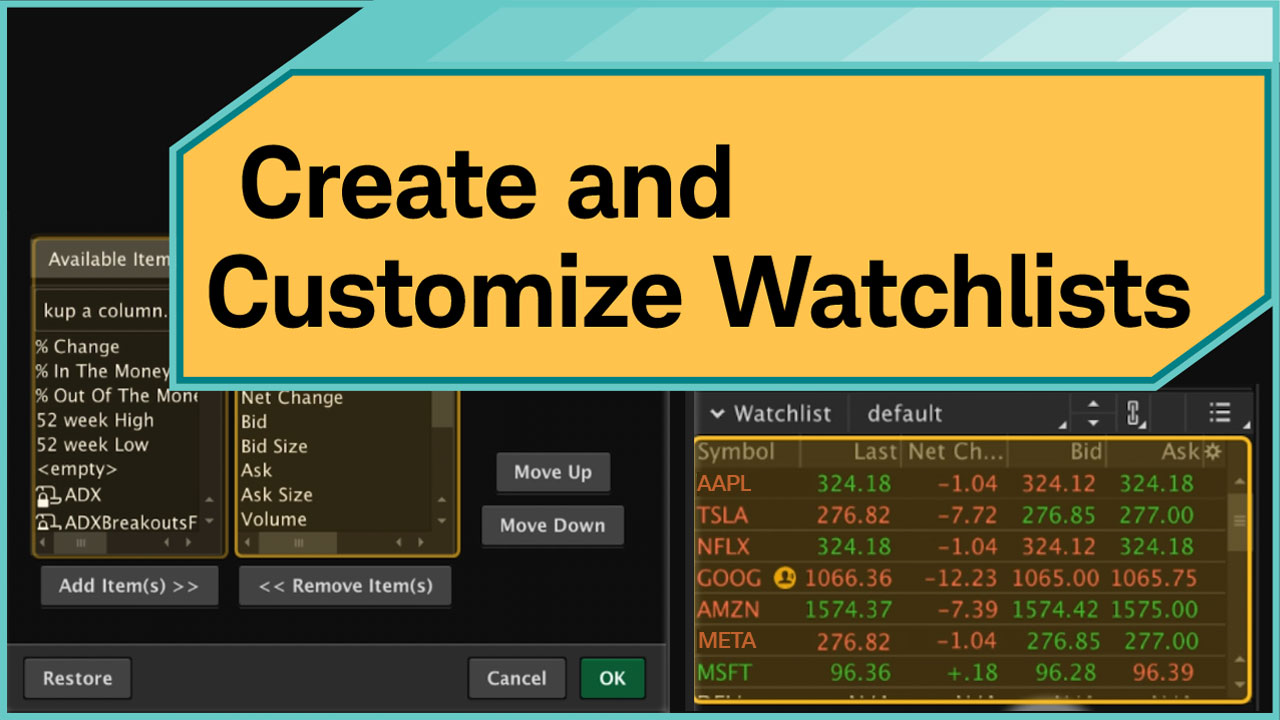
Watchlists
The left sidebar gives you a view of market data while you work across the platform. One of its most popular gadgets is the Watchlist, which lets you monitor a group of symbols and their live market data at glance.
Setting up your watchlist
- Click the watchlist name at the top of the watchlist gadget in the sidebar.
- From the menu that appears, browse the available options, including public lists such as Top 10, Lovers and losers, and industry-based lists.
- Select the watchlist you want to display.
thinkorswim® Main Tabs
The Trade tab is where you buy and sell securities. Your starting point is the All Products subtab, which gives you access to stocks, options, futures, and forex from a single interface.
Placing your first trade
To buy or sell stock, start by typing the company name or ticker symbol into the symbol selector at the top of the All Products subtab. Once you select it, the page populates with the current quote for that stock, including its last price, bid and ask, volume, and the day’s high and low.
When you’re ready to place an order:
- Click the ask price to buy, or the bid price to sell. This creates an order in the Order Entry Tool at the bottom of the screen.
- In the Order Entry Tool, click the dropdown under Order and select the desirable order type. The default order type is LIMIT. You can find more information on the order types here.
- Set the number of shares you want to trade.
- Click Confirm and Send to review your order, then click Send to submit it.
Once your order is filled, you’ll see it reflected in the Monitor tab under Activity and Positions.
For more on order types and advanced order options, see the Trade and Order Entry articles.
Trading Options
To trade options, search for the underlying stock or ETF in the All Products subtab as usual. Below the quote, you’ll find a table listing available contracts organized by expiration date and strike price, this is the Option Chain. Click the ask price of a call or put to open a long position, or the bid price to open a short one. This creates an order in the Order Entry Tool, where you can adjust the quantity and order type before submitting.
For more information about the Option Chain, take a look at All Products.
Trading Forex
Forex trading can be handled in its own dedicated subtab. Click Trade, then select Forex Trader. Currency pairs are listed in the main area of the page. Click a pair to load its quote and entry fields. Enter your position size in units and select an order type to proceed.
Trading Futures
Futures trading can be handled in its own dedicated subtab. Click Trade, then select Futures Trader. The subtab displays a set of contracts with their current bid and ask prices. Click a contract to load its order entry fields, set your quantity, and select an order type to proceed.
Note that to trade options, futures, and forex, you need to get certain permissions. To view your permissions, please see the Account features window.
Monitor
The Monitor tab is your homebase for tracking trading activity. Here you’ll find a real-time view of your open positions, working and filled orders, account balances, and profit and loss both for the day and year-to-date.
Checking your orders
Open the Activity and Positions subtab. At the top, under Today’s Trade Activity, you’ll see a real-time record of everything you’ve done today:
- Working Orders: Orders you’ve submitted that haven’t been filled yet.
- Filled Orders: Orders that have executed.
- Canceled Orders: Orders that didn’t fill and were canceled.
Checking your positions
Below Today’s Trade Activity, the Position Statement shows all your positions and how they’re performing. For each position you’ll see the current mark price, how much it’s changed, and your P/L, both since you opened the position (P/L Open) and just for today (P/L Day). Your available cash and overall P/L year-to-date appear at the bottom right.
Getting a detailed account snapshot
For a more detailed picture of your account, switch to the Account Statement subtab. This breaks down everything by category: your cash balances, order and trade history, open positions by product type (equities, options, forex, futures) and a summary of profits and losses. By default, it shows the last 24 hours, but you can adjust the date range to look back further.
For more on what’s available in each section, see the Activity and Positions and Account Statement articles.
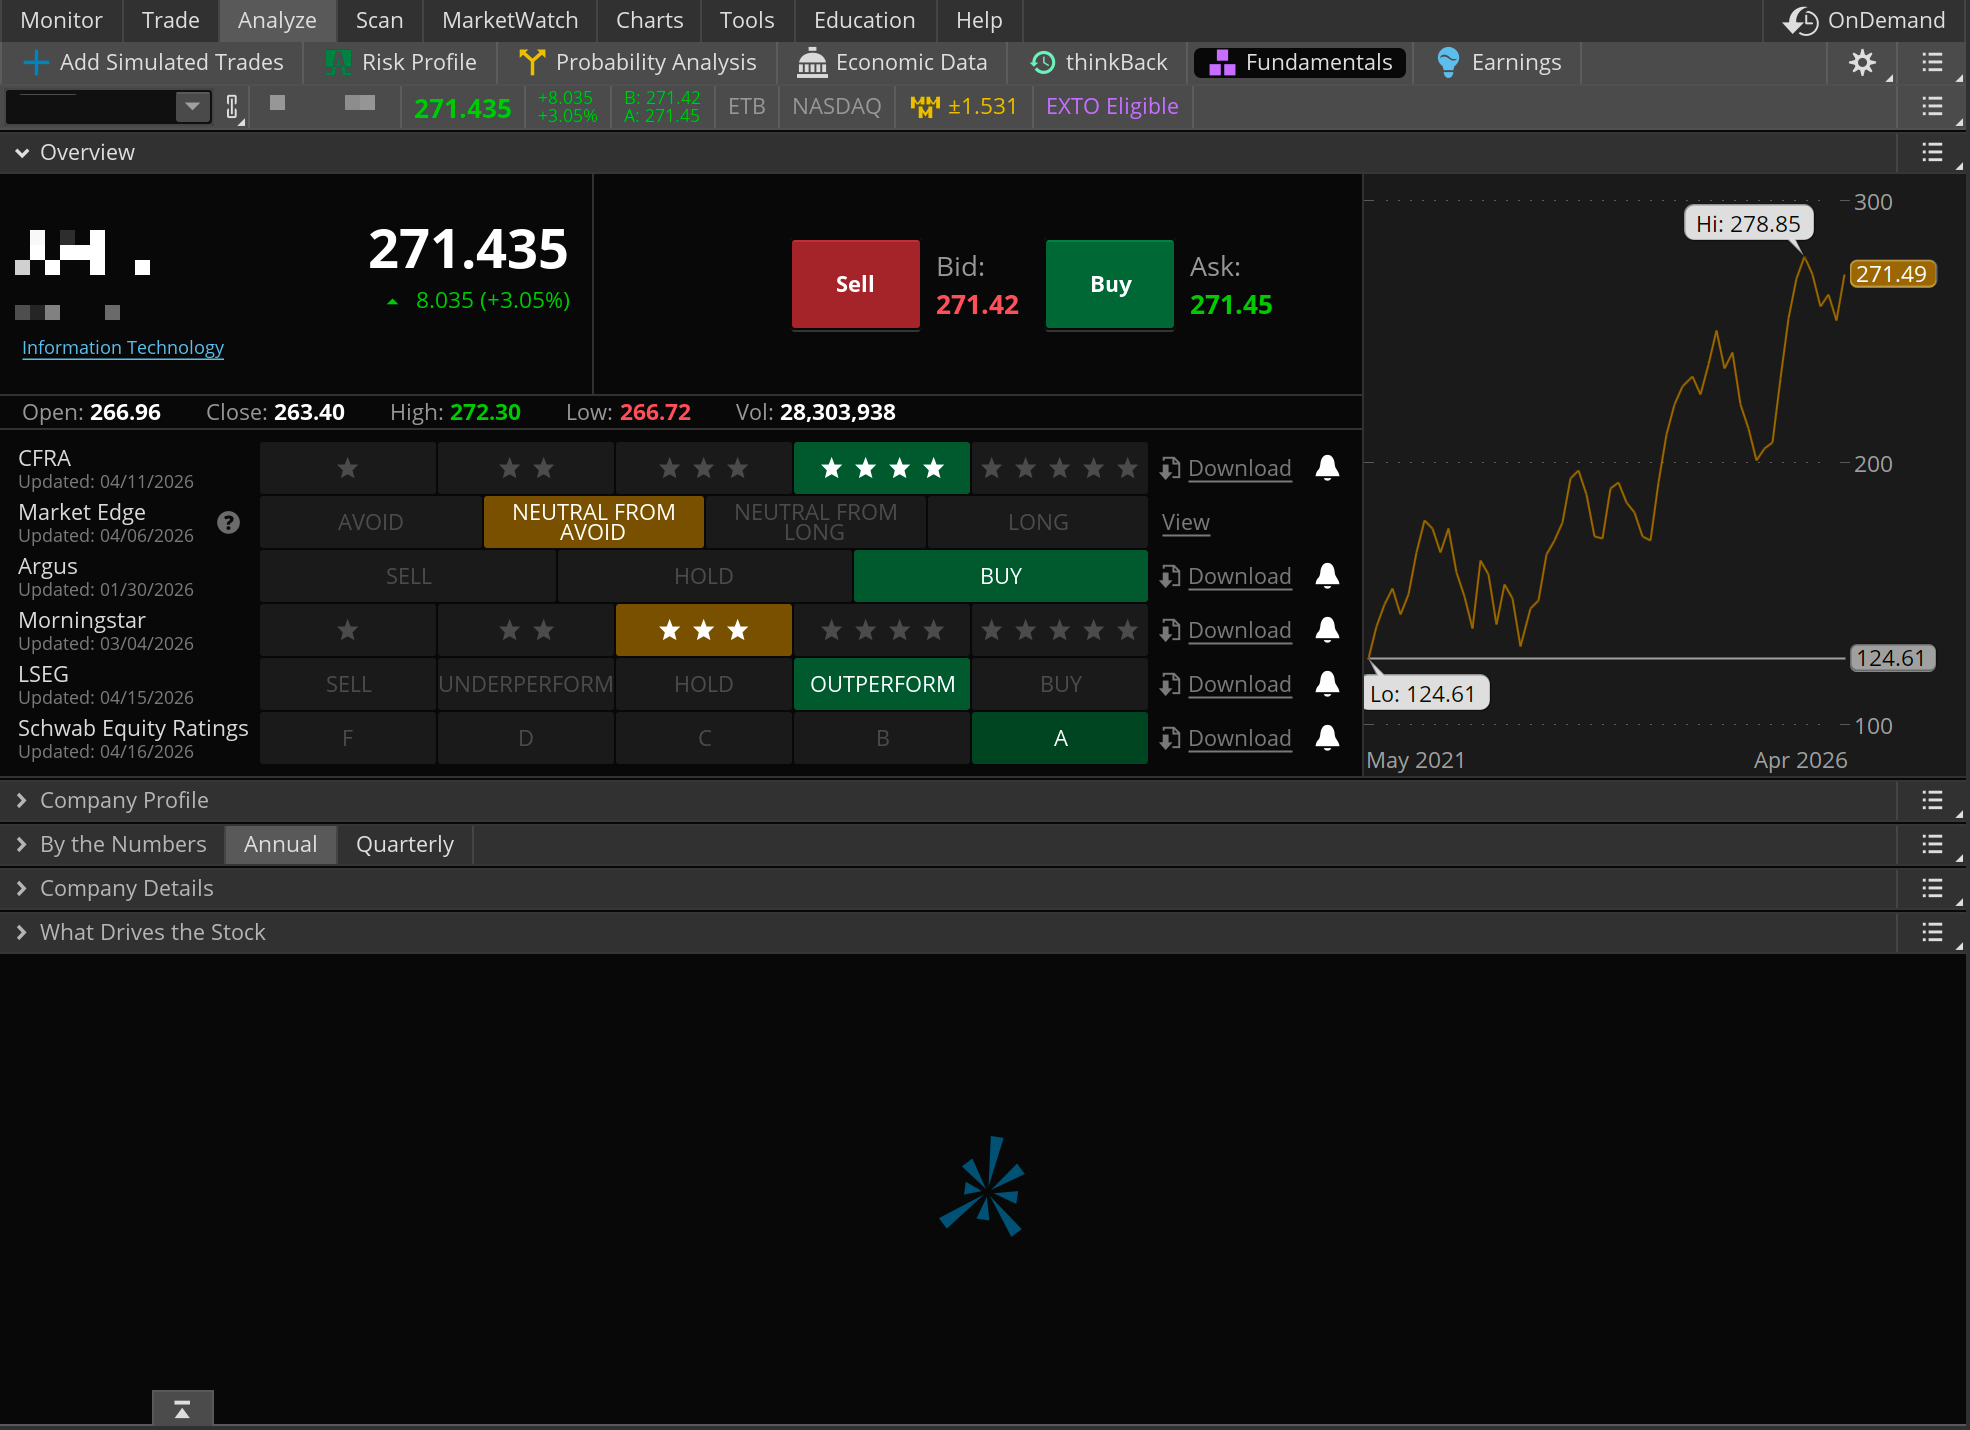
Analyze
The Analyze tab gives you the tools to research and model potential trades. The Fundamentals subtab can be a good first stop, it pulls a full company overview for any symbol you enter.
Researching a company
- Click the Analyze tab and select the Fundamentals subtab.
- Type a symbol into the symbol selector at the top of the page.
- The page populates with an overview of the company. The information includes current price, analyst ratings, and price history chart.
- Scroll down to By the Numbers, Company Profile, and What Drives the Stock sections with key financial metrics (earnings per share, profit margins, revenue and more), company details, and divisions.
For more advanced tools, including simulated trade analysis, risk profiles, and probability calculations take a look into Analyze.
Scan
Use the Scan tab to search for trading opportunities across thousands of stocks, options, futures, and forex products based on your own criteria. For a first dive, start with Stock Hacker.
Running your first scan
- Click the Scan tab and select Stock Hacker.
- In the Scan in dropdown, choose the universe of stocks you want to search. All stocks can be a good starting point.
- Click Add filter to add your criteria. You can filter by metrics like price, volume, or net change.
- Set your minimum and maximum values for each filter.
- Click Scan. Results appear at the bottom of the screen.
From the results list, you can right-click any symbol to pull up a quote, open a chart, or place a trade directly.
For more on building and saving scans, check out Scan.
MarketWatch
Navigate to MarketWatch to use watchlists, alerts, and calendar.
Setting up a price alert
- Under MarketWatch select the Alerts subtab.
- Type a symbol at the top of the page.
- Click the value you want to trigger an alert on. For example, click the bid price to set an alert when the bid reaches a certain level.
- In the dialog that opens, set your condition and choose how you want to be notified (via sound, email, or text message).
- Click Create.
For more on watchlists, alerts, and calendar events, check out MarketWatch.
Charts
Use the Charts tab to visualize price data for any symbol and apply technical analysis tools to inform your trading decisions.
Pulling up a chart
- Click the Charts tab.
- Type a symbol into the symbol selector at the top left. The chart loads automatically. By default, you’ll see a one-year daily candlestick chart with a volume subgraph below it.
- To change the time frame, click the Į button above the chart and select your preferred aggregation period and interval: for example, ī (1 day with hourly candles).
- To change the chart type, click Style, hover over Chart type, and select your preference. Candles can be a good starting point: by default, green candles indicate a closing price higher than the opening price, red candles indicate the opposite.
The Charts tab includes a wide range of additional tools, including studies and strategies, drawing tools, and pattern recognition. See the Charts articles in the Learning Center for more.
Getting Support
If you have a question while using the platform, click ° Support in the upper right corner of the main window. From there you can create a support request or access the thinkorswim Learning Center FAQ.