The Line chart displays segments that connect the adjacent close prices on the chart. This chart does not provide any information about the open, high, or low prices.
Algorithm
- Up tick color. If the current close price is higher than the previous close.
- Down tick color. If the current close price is lower than the previous close.
- Neutral tick color. If the current and previous close prices are equal.
To customize color and width of the Line chart, see Appearance Settings.
Sample
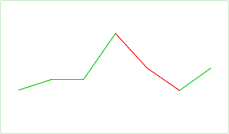
Default Colors
|
Component |
Dark L&F |
Light L&F |
|---|---|---|
|
Up Tick |
|
|
|
Down Tick |
|
|
|
Neutral Tick |
|
|